Core Hydrogen Burning (M = 1 Msun and Z=0.02)
- We start by looking at the evolution of a star very similar to the Sun: it has the same mass and almost the same composition.
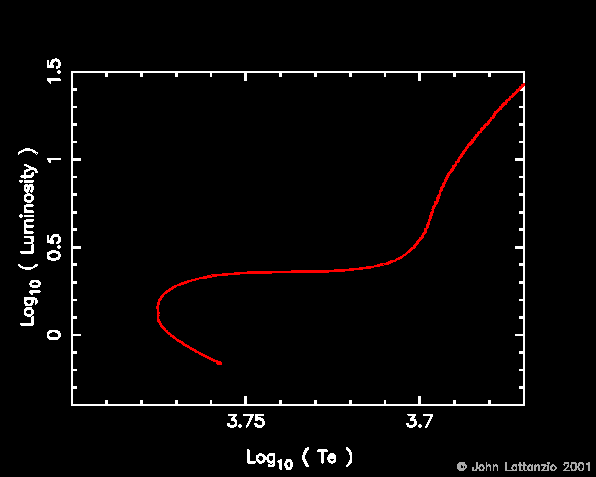
- The figure below shows the HR diagram for the main H burning phases.
The star starts on the zero-age main-sequence (ZAMS) and evolves off it and,
following the exhaustion of the core H supply, it begins to ascend the giant
branch. We will cover these in more detail below.
- This movie ( horizontal or vertical ) shows the hydrogen profiles (ie H mass-fraction versus mass) in the interior of the star as it evolves off the main-sequence. This phase ends when the central H supply is exhausted. Note that each frame corresponds to one of the symbols in the HR diagram.
- Of course, the burning of H proceeds more quickly in the very centre, where the temperature is higher. And it produces He (strictly, He-4) as the H is destroyed, as shown in this movie
- Because we are using mass-fractions, then whatever H is burned will appear as He. This conservation of mass is nicely shown in the following movie which shows both H and He profiles during the H burning phase.
- H burning in this star occurs via the PP chains, mostly, because it is not hot enough for substantial CN cycling. However, the CN cycle has reached equilibrium and we see the conversion of C-12 into N-14. As the star heats we see the advance outward of the region where CN reaches equilibrium. Toward the end of the main sequence the temperature becomes high enough for some ON cycling and we see the beginning of the conversion of O-16 into N-14. This there are two steps in the N-14 profile: the first from the CN cycle converting C-12 into N-14. The second is from the ON cycle converting some O-16 into N-14.
- The conversion of H into He raises the average mass per particle,
usually measured by mu. For a perfect gas the pressure is given by
P = rho R T/mu and since the pressure is constant (to first order) then as mu increases so must rho and T. That is, the centre of the star gets hotter and more dense, as shown in the following movies.
Shell Hydrogen Burning (M = 1 Msun and Z=0.02)
- After the central H supply is all converted into He-4, we see the formation of a H-burning shell. This sits on the edge of the H-exhausted core and progresses outward (in mass! not in radius!) as the star evolves. The star now moves relatively rapidly away from the main sequence and toward the giant branch. This, and the advance of the H shell, is shown in the next movie ( horizontal or vertical ).
- At the same time the CN profile hardly changes, as the top of the H shell has not moved very much. Rather, the H shell is advancing through the variable H profile left from the main-sequence evolution. But as the core contracts, the shell heats and we see the growth of the ON cycle, as reflected in the conversion of O-16 into N-14 in the next movie.
- Once the H supply is gone in the centre then there is no nuclear energy generation. The luminosity is just the integral of the energy generation rate over mass, and there is no longer any nuclear energy generation (there is instead some gravitational energy liberation due to the core's contraction, but this is not very large compared to the previous nuclear source). And since the temperature gradient (in the diffusion approximation) is proportional to L, then the gradient is zero, and we have an isothermal core. At least, if there was no gravitational contraction it would be isothermal. So rather we have a nearly isothermal core. This is shown in the next two movies showing the formation of a core, its initial isothermal nature, and then we see that the contraction causes the temperature to increase somewhat in the centre. But there is a clear separation between the high density, nearly isothermal H-exhausted core, and the H-rich outer envelope. Note the very steep temperature and density gradient at the edge of the He-core.
First Dredge-Up (M=1 Msun, Z=0.02)
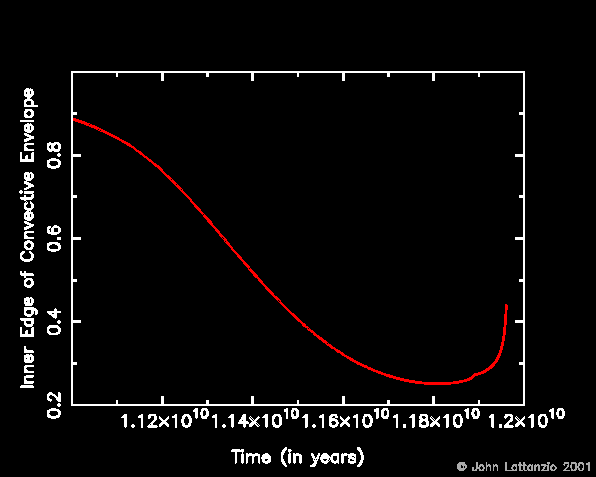
- As the star ascends the giant branch it grows in radius and
the outer envelope cools. Convection becomes the dominant energy transport
mechanism due to the increased opacity at these lower temperatures. The
innermost edge of the convective envelope moves inward as shown below.
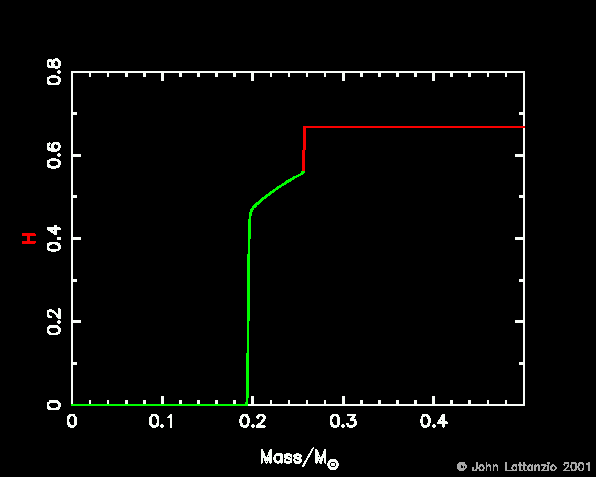
- As the convection extends inwards it can reach into regions where
there was H burning during earlier phases. The figure below shows the H
profile at a time during this phase. Convective regions are shown in red,
and radiative regions in green. The convection thus reaches into the interior
and "dredges-up" some products of earlier H burning. This is called the
"First Dredge-up" phase.
- Where the H has been burned to He there has been CN cycling
producing N-14 from C-12. Hence the First Dredge-Up will be accompanied by the
increase in the envelope abundance of N-14 and a decrease in the C-12 content.
This is shown in the next two movies:
- C-12 profiles during First Dredge-Up ( horizontal or vertical )
- N-14 profiles during First Dredge-Up ( horizontal or vertical ). Note the second rise in N-14, due to the ON cycle operating further inward (where the temperature is higher).
- C-12 profiles and inner edge of the convective envelope ( horizontal or vertical )
- C-12, N-14 and O-16 profiles during First Dredge-Up. This shows the growth inward of the convective envelope as well as the advance outward of the ON cycling part of the H-burning shell
The next movie ( horizontal or vertical ) shows the corresponding position in the HR diagram.
The next movie ( horizontal or vertical ) shows the H profiles and the corresponding position in the HR diagram.
The Bump in the Luminosity Function (M=1 Msun, Z=0.02)
- When the convection retreats again it leaves behind a discontinuity in the abundance profiles. When the H shell reaches this point it suddenly finds the abundance to be larger than required for the current structure of the shell. A hydrostatic readjustment of the structure follows, and during this the luminosity actually decreases slightly, albeit briefly, before the star continues its ascent of the giant branch. This can be seen in the next movie ( horizontal or vertical ).
- This (temporary) reversal of the direction of evolution means that there are more stars seen in this region of the HR diagram than just above or below. This causes a bump in the luminosity function of clusters.
Overview of H Burning (M=1 Msun, Z=0.02)
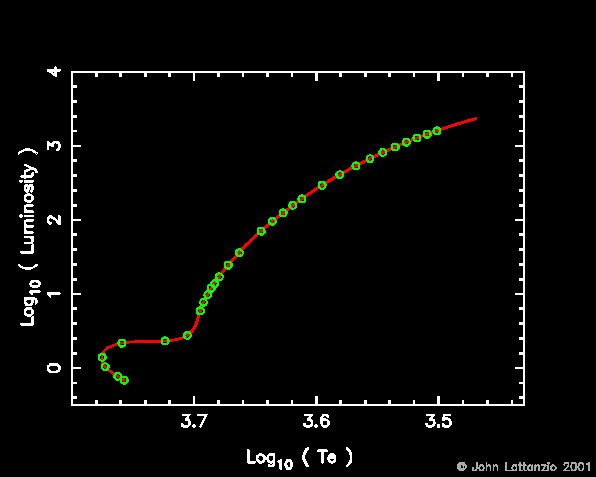
- Now is a good time to review the overall evolution during the main H burning phases. The movies below will do this. There is a frame in each movie corresponding to each symbol in the HR diagram below.
- Firstly we show the dramatic increase in radius as the star ascends the giant branch in the following movie ( horizontal or vertical ).
- As the star's radius swells, the material is less tightly bound gravitationally to the star. Also, the increased luminosity increases the linkage between grains in the envelope and the gas comprising the star. Hence the mass-loss rate increases. Here we used a Reimers mass-loss formula, and the resulting decrease in mass is shown here ( horizontal or vertical ).
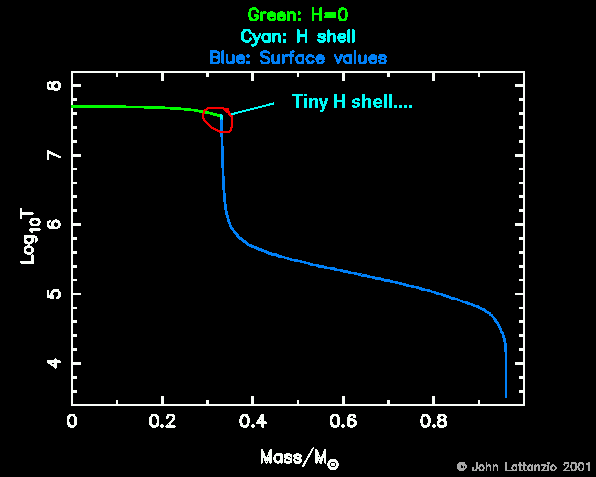
- The next movies use colour coding to illustrate certain features of
the star. Wherever all the H has been burned we draw the line in green.
Where the H still has the surface value we draw the line in dark blue.
In between, where the H abundance is somewhere between zero and the surface
value we draw the line in cyan. This indicates the position of the H-shell, or
the regions of variable H abundance. An example of such a frame is shown
below, where we plot temperature vs mass. You can see the isothermal
H-exhausted core (in green) very clearly. The H shell is indicated in cyan,
and this figure shows how narrow is the H-shell (in mass).
- The next movie shows the H profiles along the HR evolutionary track ( horizontal or vertical ). Note that the outer edge of the graph moves inward, reflecting the decrease in the total mass of the star.
- Here we show the temperature profiles during the H-burning evolution. Watch the formation of the isothermal core, once H is exhausted in the centre. Look also at how quickly the H shell thins to a tiny cyan dot!) Watch this movie carefully: there is a lot of information here!
- This movie shows the density profiles. Again, we clearly see the formation of the He-core and the very thin H-shell.
The Core Helium Flash (M=1 Msun, Z=0.02)
- We resume the evolution as the star ascends the giant branch.
The He core is contracting and gradually heating, but it is also getting
denser and more degenerate. A completely degenerate gas has a polytropic
equation of state, which means that the pressure is given by
P = K rho^gamma and has no temperature dependence. A discussion of the physics of degenerate gases is available in the full version of this tutorial.When the temperature finally reaches enough for the ignition of the He burning (via triple-alpha reactions; about 100 million degrees) the extra energy released does not go into expansion, but rather increases the local temperature. Due to the degeneracy, this simply causes the burning rate to further increase, and we have a runaway! This is called the core helium flash.
- There is another complication too. The high density of the
core enables various neutrino processes to remove energy from the core.
Since these
processes depend mostly on density, they are more efficient in the
very centre. Hence this region cools more than zones just outside the
centre. The result is that the maximum temperature in the star moves away
from the centre, and slightly outward in mass. The helium flash is ignited
at the point of maximum temperature, of course. Hence the flash begins in a
shell (in this spherically symmetric calculation!) somewhat displaced from
the centre.
Here we show the maximum temperature within the star.

And below we see the mass where this maximum temperature occurs. Note that it is initially in the centre, but finally moves somewhat away from the centre.

In the full version of the tutorial we show the central density and the density at the point of maximum temperature. Note that they start to differ when the point of maximum temperature moves away from the centre.
- Here we see the temperature
profiles during the ignition of the flash. This shows that the huge
energy deposition drives a convective zone which reaches almost all the
way to the H shell.
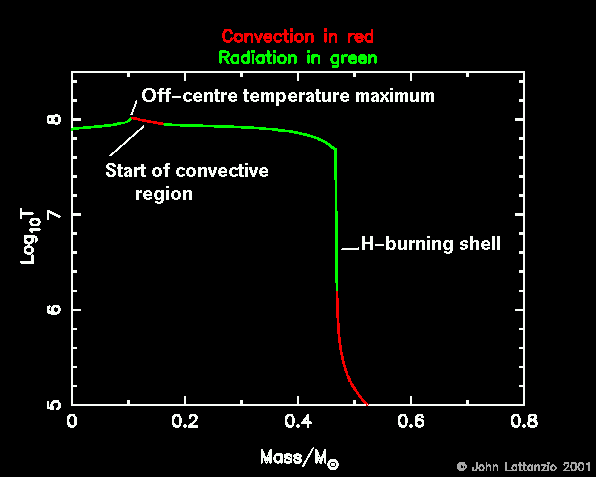
Note how the temperature of the whole core region decreases: this is because the energy released by the flash is mostly used in changing the equation of state of the core: it "lifts" the degeneracy and restores a more nearly perfect-gas equation of state.
- A similar story is revealed in the density profiles: the core expands dramatically as a result of the energy input from the helium burning.
- The radius profiles also show the expansion of the core. Note that this is a log plot!
- Of course, the luminosity profile is going to be impressive!
There is a small jump in L at the position of the H shell, but this is soon
dwarfed by the energy produced by the He flash.
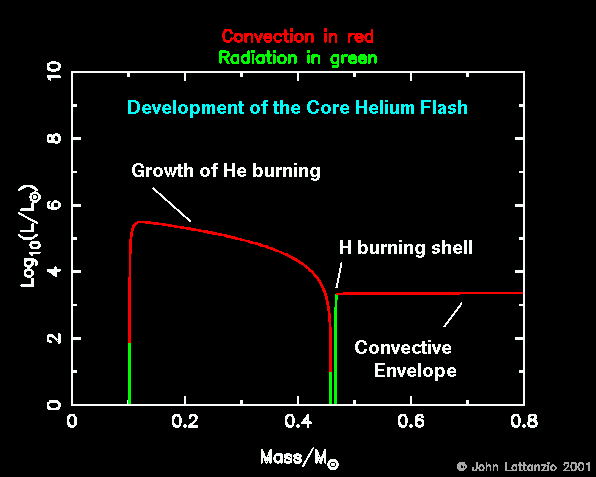
Of course, the flash does not last long, as shown in the movie.
- The He burning produces C-12. And the convection mixes the C-12 throughout the convective region. The C-12 profiles show this, but we must remember a couple of assumptions that are unlikely to be true: that we can ignore dynamic terms in the equation of motion, and that the mixing is instantaneous. Certainly for the time-steps required during this calculation, these approximations are not valid! But nevertheless we see stars in the next phase which look very much like the models. This is encouraging, but we must remind ourselves that these models must have limitations that we cannot yet determine.
- It takes more than one of these flashes to remove the
degeneracy on the core, and for the model to make its way to the Zero-Age
Horizontal Branch.

Note that the He luminosity reaches almost to 10^10 Lsun, but that the surface value changes very little! Also see that the H luminosity drops to zero: the expansion causes the H shell to be pushed outward and cool so much that the H burning stops. The subsequent flashes are much weaker.
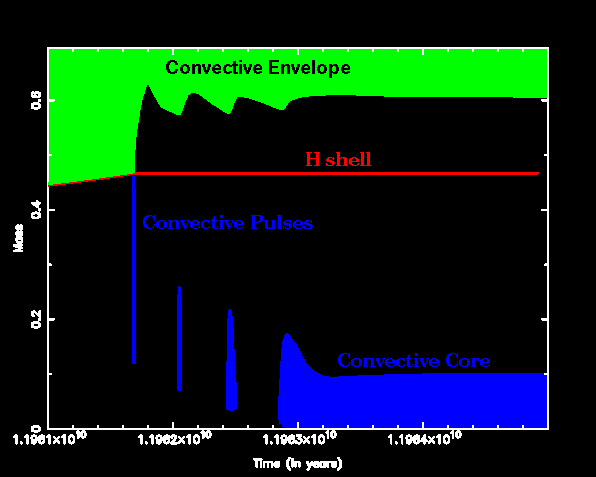
Below we show the convective regions in the star. There are a couple of mini-flashes, but they also drive convective zones, Note that each successive flash occurs closer to the centre than the one before it. Eventually the convective zone of the flash settles down to being the steadily burning helium core.
Core Helium Burning (M=1 Msun, Z=0.02)
- The star now begins evolution with two energy sources: a He-burning core and a H-burning shell. This movie ( horizontal or vertical) shows the interior profiles of He as the star proceeds through the HR diagram. Note that we have colour-coded the He profiles here according to the H and He abundances
- Semiconvection: now comes the fun bit!
- It is not our aim here to go through all the details of semi-convection. Rather, as with the rest of this page, we use results to illustrate the principles. You are referred to the Castellani, Giannone and Renzini papers from 1970 for an excellent discussion. But here we show the latter stages of the core helium burning evolution of out M=1 Z=0.02 model.
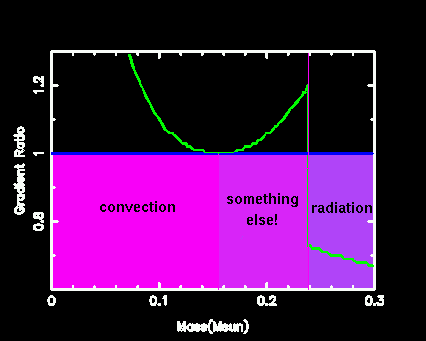
- Initially the burning of He into C-12 increases the opacity in the core. Hence the radiative gradient increases, and hence the ratio of the gradients increases. But on the other side of the convective border there is no change in the composition (recall that the burning is happening in the very centre, but convection covers a much larger mass than the burning zone, so that there is a discontinuity in the composition at the edge of the convective core: just outside is a radiative region where there is no nuclear burning). So we have a discontinuity in the composition and also the ratio of the radiative to adiabatic temperature gradients, as shown below.
- But note that the edge of the core has a large discontinuity in the ratio of the gradients. This means that there is a finite acceleration (buoyancy) on the inside. The point where the gradients are equal may be neutral (and hence define the Schwarzschild boundary) but there is no such neutral point here. On the inner side there is a positive acceleration outward, and on the opposite side there is a restoring force back inward. Surely in this case the core will grow, due to overshoot beyond the theoretical Schwarzschild boundary. This is seen in the evolution, the mass extent of the convective core grows due to the conversion of He into the more opaque C-12.
- But look again at the ratio of the gradients. Do you see how it turns up at the outer edge? So although the size of the core progresses through overshoot, something strange will happen. As we mix more He into the core (the outer region is rich in He as there is no burning there) then we gradually lower the entire value of the ratio of the gradients throughout the core. As a region falls below unity, of course, then the convection disappears and radiation carries the energy. Due to the local minimum in the ratio of the gradients (in the core region) the first point to become radiative will be this local minimum. What will happen then? Do we have a convective zone on either side?
- Well, no. The growth of the convective core is being driven by the mixing of carbon rich material to the edge. Once the convection is "pinched off" at the local minimum in the gradients the inner region can continue to be convective, but the outer region is now separated.
- A little thought will reveal that the only stable configuration is one where the region is partially mixed, so that it maintains neutrality. The full version of the tutorial contains a full discussion of the phenomenon of semiconvection, better quality images, and more movies to explain this complex phenomenon.
- The next movie ( horizontal and vertical ) shows the helium profile and the ratio of the gradients. Watch the growth of the core by overshooting, and then the lowering of the ratio of the gradients until the semiconvective region forms. Then you can see small radiative and convective zones work to mix He into the core.
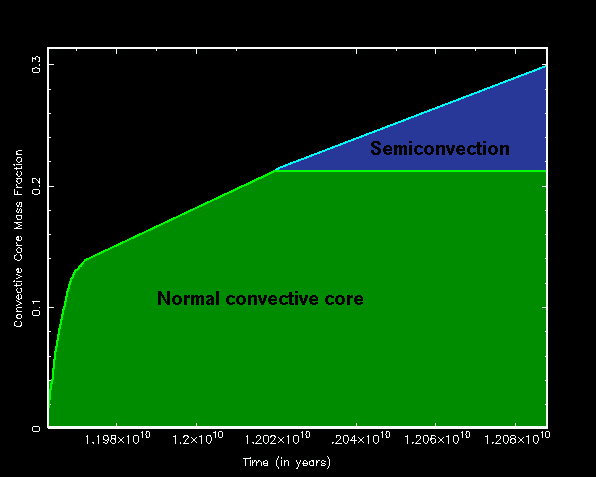
- What usually happens is that the convective core grows till it reaches some value, and then the semiconvection begins to appear (when the local minimum in the ratio if the gradients reaches unity). The semiconvective zone grows in size as the evolution proceeds, until it usually encompasses about half as much matter as the convective core (on average), as shown in the schematic diagram below. Note that there are many ways to calculate the semiconvection and the associated abundance profile. Most of these give smooth abundance profiles, unlike shown above. But I have done this deliberately because I think it illustrates the physics of the phenomenon, even if on average it is rather smooth in reality.
- As He-4 burns it initially produces C-12. But once there is a
substantial amount of C-12 then we get O-16 from
C-12(alpha,gamma)O-16 as shown in the C and O profiles movie.
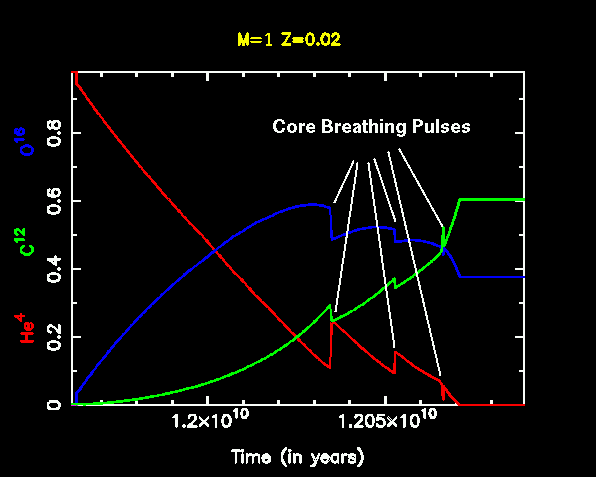
The time dependence of the central abundances of He, C-12 and O-16 are shown below. The strange spikes are caused by "core breathing pulses", a discussion of which will be added "soon".


Toward the Asymptotic Giant Branch (M=1 Msun, Z=0.02)
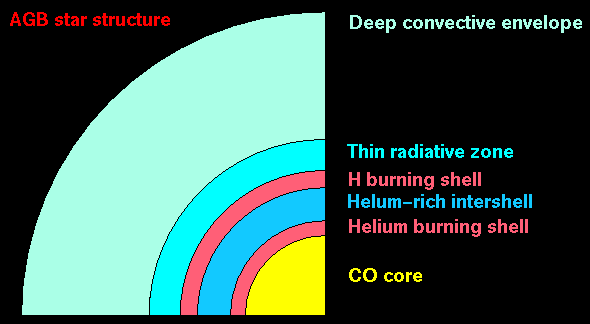
- Once the central helium abundance is exhausted the star will begin its ascent of the second, or asymptotic, giant branch. Details of this evolution can be found here. The schematic structure of such a star is shown below.
